Introduction
This guide describes the construction of simple population models. It is linked to the Cull Planning and Management Plan guides.
Using models
A population model is a tool that helps to predict the effect of a culling strategy as an aid to decision making. A model is not always required, especially where cull targets are very simple. Models can be run annually using updated information to guide the next year’s cull, as well as over longer time spans to predict the long term effect of a culling policy. There are different levels of complexity and models are only as good as the information that is put in.
Model parameters
The information required to build a model is detailed below
| Information type | Comment | Source of information | Minimum information required | Useful additional information |
|---|---|---|---|---|
| Starting population | Will be an estimate only. Population is often underestimated. A known minimum number is a good starting point. | Census (see Census guide). Consistency in count methodology is important to ensure that real changes are being seen. | Estimate of total population. Number of breeding females. Breeding females will include the adults plus yearlings and even females<1year if they are known to produce young | Number of animals in every age/sex class. |
| Recruitment rates | Male fertility is usually assumed to be 100% in all animals above 1 year old. Female pregnancy rates (estimated from culled females) give some indication of potential recruitment. Census may give an indication of proportion of young that survive. | Census and cull data – provided both involve a significant proportion of the population. When calculating the female:young ratio from Spring census counts remember to include the females /young culled during the winter, (see Census and Cull Records guides). Published literature can be used as a guide if other information is not available. | Average number of young that survive and are likely to become adults, per breeding female. | Recruitment rate for every female age class. |
| Male: female recruitment ratio | Usually assumed to be1:1 i.e. equal numbers of male and female young are born | |||
| Natural mortality /accident | Animals lost for reasons other than culling. Can be estimated for animals < 1year. For adults natural mortality is usually approx 2% in each age class of adults in moderately culled populations except in oldest expected class where it can be assumed to be 80-100%. Include road accidents etc and in some years the effect of particularly harsh climate. | For animals < 1 year a comparison of spring census data (female to young ratio, taking into account the cull) with embryo data from previous winter cull will give some indication. May be variable from year to year. Published literature. | Estimated natural mortality rates for each sex, both young and adult. | Natural mortality rates for all age classes |
| Immigration and emigration | Usually assumed as zero. Adjustments to model predictions can be made if deer movements can be confirmed. |
|||
| Projected cull figures | Decided by deer manager according to objectives. Figures must be realistically achievable. | Cull plan or “what if” scenarios. | Cull figures for adult females, adult males and young. | Cull figures for every age/sex class in the model. |
Note: Not all of the information listed in this table may be available. Data derived directly from the population that the model seeks to represent is always the best and can be gathered from season to season. Estimates or published data can be substituted but the chance of the model being a good representation of the real situation may be lower.
Building a simple population model
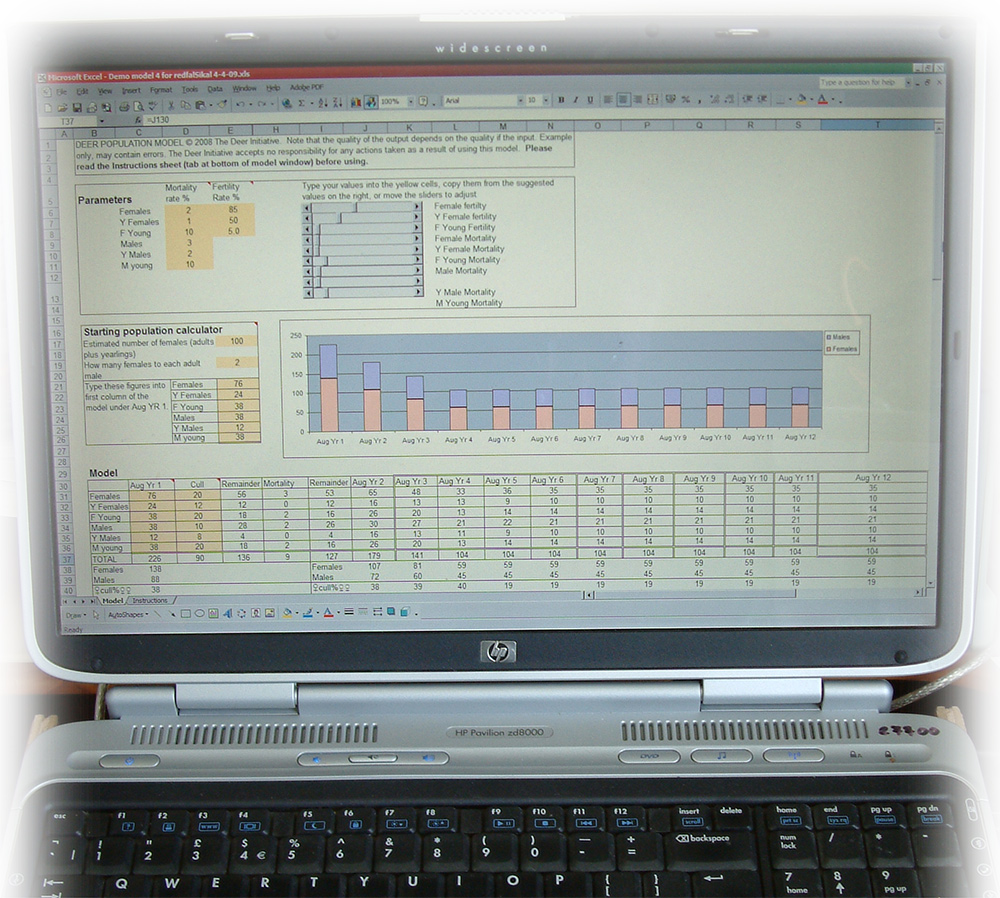
The best way to build a simple population model is to use a computer spreadsheet, but the same principles can be applied to paper based models.
Simple models follow a straightforward process. The starting time for the model is usually post summer (max population) or post winter and cull (minimum population). Assuming a max population start:
- Estimate starting population i.e. numbers for each age class in the model. In very simple models this may be just the numbers of males and females and young (i.e. just 3 age/sex classes). Alternatively the numbers of adults, yearlings and young for both sexes (6 classes) might be included or, in more complicated models all age classes for both sexes might be included (24 or more classes for long lived species);
- Apply male and female culls;
- Apply estimates of natural (winter) mortality. This step is usually applied immediately after the winter cull and before the young are born;
- Use remaining female numbers to calculate the likely number of young. Young for all species are assumed to be born from May-July;
- Increase the age of all except the new born animals by one year (only required in models where age classes are treated independently and recruitment or mortality varies with age)
- Calculate new maximum population.
- Repeat steps 1-6 as appropriate.
This process can be repeated using the same (or different) parameters for, say, up to 10 years, but it would be unwise to extrapolate much further. Remember a model can never be accurate in the sense that it can reflect precisely what is happening on the ground, but it can be a useful indicator of trends and of the likely effect of a culling strategy.
Interpretation of population models can be difficult, users are strongly advised to seek specialist advice before basing culls solely on a model.
Further Info
An example of a spreadsheet population model can be found in the Associated Information section of these guides.
A more detailed deer population model has been developed by Forest Research, see Armstrong, H.M., Bathgate, S. & Handley, P. (2007). Excel red deer population dynamics model, see http://www.forestry.gov.uk/fr/INFD-6CHC56 for contact details.